

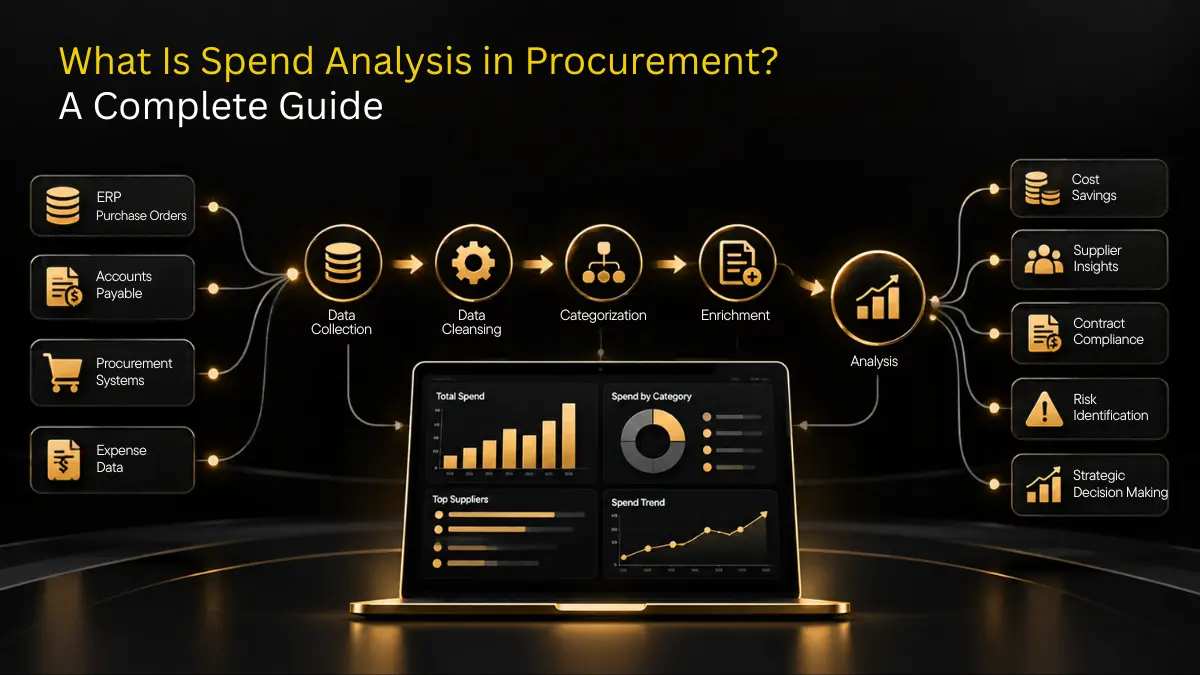
Spend analysis in procurement is the process of aggregating, cleansing, categorizing, and analyzing purchase data to identify savings opportunities and understand what, whom, and where the company buys from. Teams use this data to reduce spend, increase contracting compliance, and minimize suppliers.
Key Takeaways
- Spend analysis makes disparate purchase data actionable by creating a categorized summary
- Cleansing and categorizing are essential preparatory steps for analysis.
- Tail spend and MRO categories tend to have the most wasteful opportunities because of their size and complexity.
- Focus on a handful of key performance indicators (KPIs), such as spend under management and contract compliance.
- Automated tools make spend analysis scalable and keep the data up-to-date.
What is Spend Analysis in Procurement?
Spend analysis in procurement is the process of aggregating, cleansing, categorizing, and scrutinizing spend data. At the same time, the objective of spend analysis is to reveal insights into spend patterns and potential procurement savings.
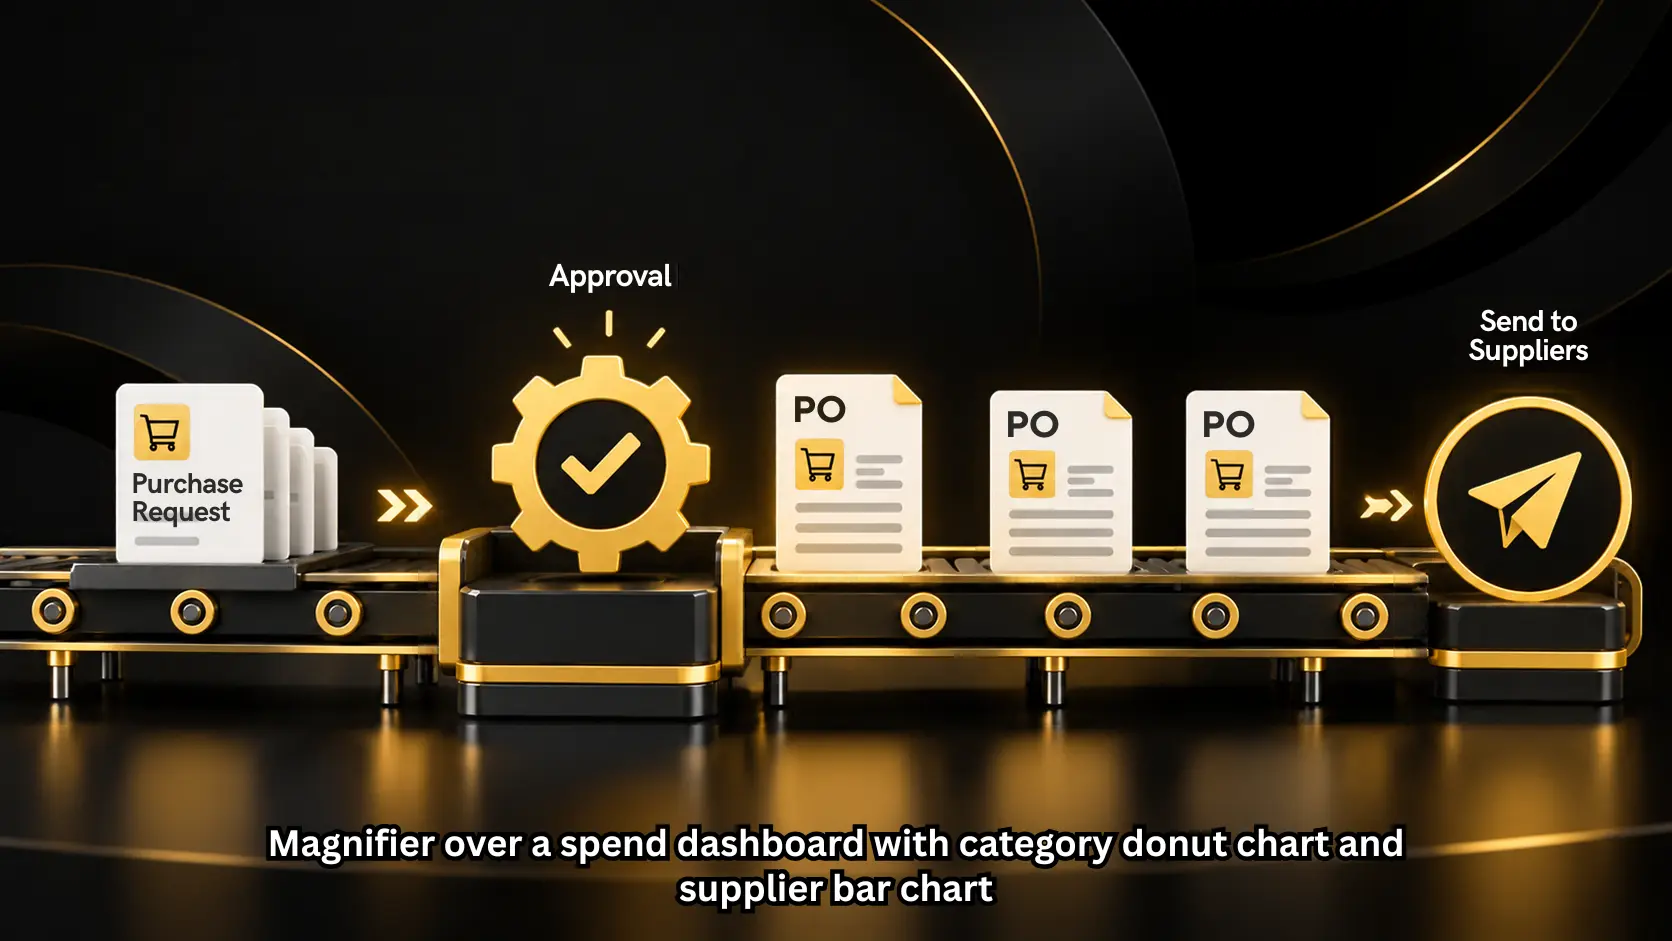
Spend analysis involves integrating purchase data already present in most organizations. In any company, purchase orders and invoices, expense reports, and payment records are some examples of spend data documentation. The problem with spend analysis in procurement is that this data is scattered across different databases and categorized differently. For example, one supplier may be identified as “ABC Ltd,” “ABC Limited,” and “A.B.C. Pvt” in different databases.
Spend analysis in procurement is often seen as the key procedure for answering questions such as how much was spent on packaging in the last quarter or how many suppliers were used for identical products. It also helps answer questions like what percentage of spend went to unauthorized vendors or which departments make purchases outside of contract language.
The term spend analysis in procurement sometimes overlaps with the term “spend analytics.” In practice, spend analytics is the software application procurement analysts use. Spend analysis, by contrast, refers to the periodic task of examining and scrutinizing spend data.

By 2029, 80% of human decisions will be augmented by generative AI, transforming procurement operations.
– Gartner
Why Procurement Spend Analysis Matters?
Procurement spend analysis matters because companies cannot control what they cannot see, and visibility helps them identify savings opportunities, improve compliance, and assess risk in each category.
1. Visibility Comes First
The executives have limited visibility into spend by category. Analysis consolidates the information to give finance and procurement a single version of the truth. It also eliminates the age-old argument over who is right between the finance and procurement departments.
2. Savings Follow Visibility
While the analysis helps consolidate spend, it also helps the procurement team identify savings opportunities. Spend analysis consolidates spend, and that shows procurement where the savings are.
According to McKinsey, procurement-led transformations revealed that companies usually targeted for improvement ranged from 15 to 30 percent savings over two years, compared to 3 to 5 percent for business-as-usual savings per year.
So, not necessarily hard numbers, but expectations, are good to look at. And it all depends on how much of your spend is fragmented and what the forces in the marketplace are.
However, treat these numbers as benchmarks, and look at the current market and how fragmented spend is to determine actual savings potential.
3. Risk Becomes Measurable
Finally, spend analysis helps measure risk exposure. For instance, if a company relies on a single supplier for a particular category, then any disruption will cause company-wide delays. With this information, procurement can identify strategic sourcing opportunities, such as finding a backup supplier.
Transform Your Procurement Process with Ease

Types of Spend You Will Analyze
Spend falls into three broad groups: direct, indirect, and tail. Each group needs a different analytical approach.
| Spend type | What it includes | Analysis focus |
|---|---|---|
| Direct spend | Raw materials, components | Price trends, supplier terms, volume leverage |
| Indirect spend | IT, facilities, travel, services | Category ownership, contract coverage |
| Tail spend | Low-value, scattered purchases | Supplier consolidation, off-contract buying |
Tail spend deserves special attention. Zoho reports that tail spend represents 10% to 30% of total procurement spend in many organizations. ProcureKey puts it at about 20% at most organizations. The two figures overlap, so a fair rule of thumb is that one dollar in five sits in a corner nobody manages.
How to Run Spend Analysis in Five Steps?
A repeatable process for analyzing spend data consists of five steps: collect, clean, categorize, analyze, and act. One step that is frequently skipped, and which can cause analyses to go awry, is the cleaning and normalization of data.
- Collect the data: The data may reside in ERP systems, accounts payable databases, purchasing cards, procurement systems, and contracts if available.
- Clean and normalize the data: This involves standardizing supplier names, eliminating duplicates, and filling gaps in the data. Categorize the data into groups such as IT, marketing, facilities, and professional services.
- Analyze the information: The types of analysis include spend by category and supplier, spend by department, and spend by time period. Benchmarking prices paid for the same item against each other is an example of an analytical technique.
- Act and track: The results of the analyses should translate into sourcing events, renegotiations of contracts, or policy changes. It is important to then track whether the projected savings are actually realized. Following up on the original findings is crucial to ensuring that the program delivers the benefits it promises.
- Start with the largest spend: In many cases, it is logical to start your analysis with the largest spend. For instance, in most organizations, at least 80 percent of the spend will be with the top 20 percent of suppliers, making it logical to classify these suppliers first, since they entail the most work for the greatest rewards.
The following is an example to illustrate the kinds of savings that may be found with such an analysis.
Imagine a midsize manufacturer that finds 14 different suppliers for safety gloves at its five plants, each buying at a slightly different unit price. By consolidating the five different contracts into a single contract with two suppliers, the company could get a far better price than any of the plants had previously received. Such an opportunity is not unusual after the first round of analysis.
Vendor and Supplier Spend Analysis
Vendor spend analysis examines the amount spent with each vendor as well as the nature of the relationship to ensure value for money. The terms “vendor spend analysis” and “supplier spend analysis” are essentially the same thing, with different spins on the subject.
Check Supplier Concentration
Rank suppliers against total spend and concentration across categories. With high concentration comes leverage either for or against the buyer depending on switching ease.
Compare Prices Across Sites
Price variance is the area in which spend analysis delivers the quickest wins – when two plants are paying different prices for the same item, the spend analyst will target the higher-paying plant. Contract compliance rate – the percentage of spend that is on contract – indicates what proportion of variance is exploitable.
Look for Duplicate and Overlapping Vendors
Mergers, decentralized buying, and poor onboarding create duplicate vendors. Deduping these will reveal true spend per supplier – which can change spend rankings dramatically for the Top 10.
Spend Analysis in Supply Chain Management
Spend analysis in supply chain management applies spend analysis to procurement decisions relating to sourcing and managing material flows. The focus is on cost rather than price. Reliability and continuity come into play here.
Supply chain managers will use spend analysis to inform where to consolidate spend, where to source from based on regional risk, and what categories to prioritize based on spend concentration. If 60% of spend on a particular product category is with suppliers in one region, then a disruption to that region will impact that spend stream.
Spend analysis in supply chains informs demand planning. An increase in spend in a particular category can be interrogated to see whether this reflects volume increases, price increases, or emergency spend. Often, emergency spend is an indicator of a planning shortfall further up the supply chain, which will be more costly to remedy than modifying a purchase contract to allow for higher volumes.
MRO Spend Analysis
MRO spend analysis focuses on maintenance, repair, and operations spend. This spend category presents a particular challenge to procurement analysts since it is both transaction-heavy and fragmented across sites.
The numbers speak for themselves. Colab91, citing RS Integrated Supply, reports that MRO materials represent 5% of total spend but can account for up to 80% of procurement transactions.
MRO spend data will often represent a hurdle in spend analysis due to the way they are usually captured. According to Verdantis, MRO records rarely follow master data conventions and often use free-text item descriptions. One bearing can be captured in five different ways in the source system, creating five different items in spend analysis. Three best practices here:
- Classification by criticality: Not all spares are equal. Some carry a much higher risk profile than others: a conveyor motor has a much higher risk of failure than a label. Spend classification needs to take this risk into account.
- Link to maintenance: By linking MRO spend data to maintenance records, analysts can separate planned spend from emergency spend. This will inform spend prioritization and investment in preventative maintenance.
- Segregate planned spend from emergency spend: Emergency spend often incurs penalties due to expedited freight costs. One case study cited by Verdantis shows that a significant proportion of MRO spend was being incurred on emergency repairs due to a lack of preventative maintenance spend.
Spend Analysis Reports and KPIs
Spend analysis reports present findings by category, supplier, department, and time. Good reports focus on a handful of KPIs rather than dozens of charts.
| KPI | What it tells you |
|---|---|
| Spend under management | Share of spend that flows through governed procurement channels |
| Addressable spend | Spend that could be sourced competitively but currently is not |
| Contract compliance rate | How often buyers pay the negotiated price |
| Supplier concentration risk | Exposure if a key supplier fails |
| Savings capture rate | How much identified savings reached the financial results |
Savings as a percentage of spend provides a different perspective on the value created by sourcing work to balance against the spend budget it covers.
Savings capture rate needs more and more attention since many sourcing teams report savings at the time of contract award, but finance sees value only when the spend occurs in accordance with the new terms. The process of capture tracking keeps both numbers honest.
Establish a reporting cadence that reflects how quickly spend will occur within a category. Quarterly is appropriate for more stable categories, while monthly is better for more volatile categories like freight, commodities, or tail spend categories that are growing rapidly.
Common Challenges and How Software Helps
The main challenges are messy data, manual effort, and out-of-date results. Procurement software is able to address all three of these by automatically classifying and constantly refreshing reports.
Spreadsheets are notoriously error-prone and time-consuming for analysts, who may spend weeks pulling together different files before finalizing a report and presenting it to leadership. Tail spend exacerbates the issue, since thousands of small transactions are left unreviewed by humans each month.
Platforms like Zapro AI seek to remedy that. The vendor’s spend analytics can automatically classify all transactions and highlight savings by category, vendor, and department while also providing real-time updates on ERP integrations.
Zapro bundles spend analytics with vendor management, purchase orders, invoice matching, and contract management tools in one platform, which is valuable to a company’s purchasing and financial departments.
This combination is particularly valuable to a company considering the alternative of using different systems to analyze spend data and separately manage procurement, since it reduces the need for data cleansing at the start of a spend analysis project. Teams weighing that trade-off can review Zapro pricing alongside the cost of running separate tools.
Assess each tool‘s ability to handle free-text fields, its ability to integrate with your ERP, and how quickly suppliers appear in reports. Test it on one category, such as MRO or facilities spend, before scaling up to a companywide analysis.

Get Started with Procurement the Zapro Way
Simplify purchasing with Zapro — procurement made smarter and effortless.
FAQs
1. What is the difference between spend analysis and spend management?
Spend analysis is the process of reviewing historical spending data to identify patterns, while spend management is a broader term that encompasses spend analysis as well as policies on approvals and ongoing management of spend.
2. How often should a company conduct a spend analysis?
Conduct an in-depth analysis at least once a year, and update reports at least once every quarter. Some categories require a more frequent review.
3. What data do I need to gather for spend analysis?
Start with data on accounts payable, purchase orders, purchasing card data, and any available contract information. ERP exports will include most of these.
4. What is tail spend?
It is spend on a large number of low-volume contracts. Spend analysts are especially interested in tail spend because it can comprise 10-30 percent of a company’s spend, and be the least understood and controlled area of procurement.
5. Is spend analysis only relevant for large enterprises?
Spend analysis can be relevant for companies of all sizes, since a small number of contracts may allow for significant savings. The main difference is that larger firms have more spend to analyze, and an entry-level analysis may take more time before it identifies opportunities for renegotiation. A tight budget may be addressed by starting with a spend analysis on one category and a spreadsheet.
References
- Zoho Procurement Academy: Tail Spend Management (2026)
- Zapro: Spend Analytics Software (2026)
- Zapro: AI Procurement Software (2026)
- EmpoweringCPO: Spend Analysis in MRO (2024)
Don’t miss our weekly updates
We’ll email you 1-3 times per week—and never share your information.
Let’s Streamline Your End-to-End Procurement
We’ll unify your P2P process and empower your team to work smarter.

About the Author

Md. Kafil


About the Reviewer

Zapro is dedicated to helping businesses of all sizes make informed decisions. We adhere to strict editorial guidelines to ensure that our content meets and maintains our high standards.
Our editorial standards help keep every article accurate, useful, and trustworthy.
Related Blogs