

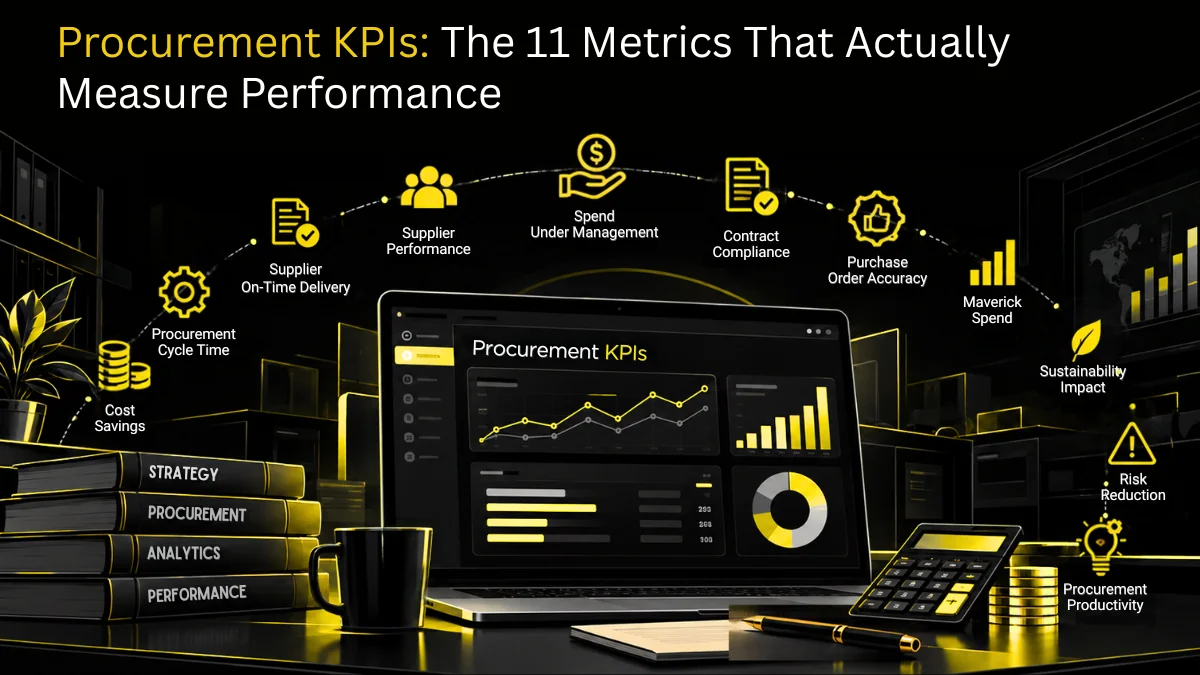
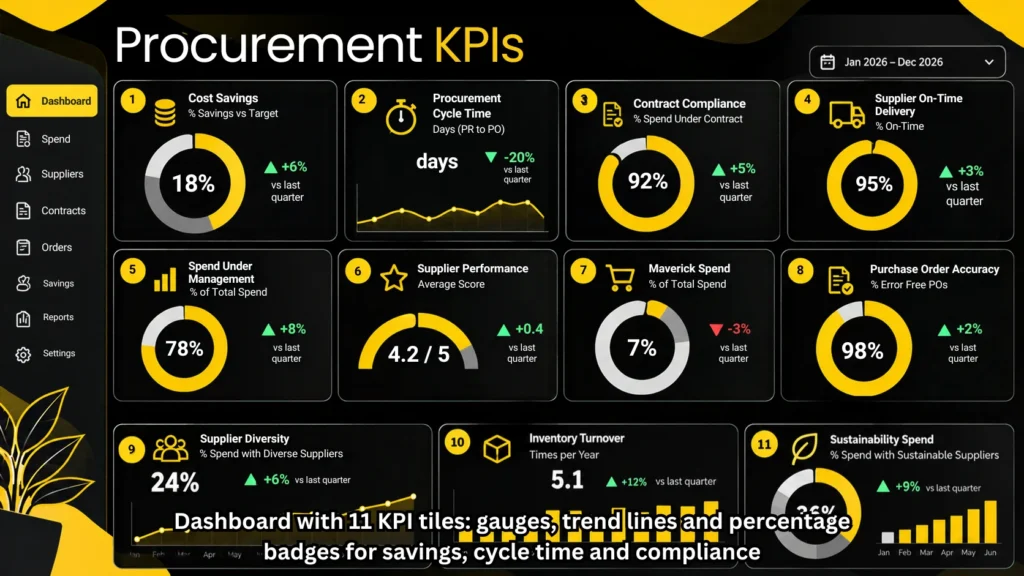
Procurement KPIs, also called procurement performance metrics, are measurable indicators of how well the procurement function performs on cost, speed, vendor quality, compliance, and risk.
This guide covers 11 procurement KPI examples with formulas, what APQC benchmarks say good looks like, and how to pick six to eight to report.
Key Takeaways
- Procurement KPIs tie daily buying to company goals and give procurement the numbers to make its case to leadership.
- The right metrics expose bottlenecks across the procure-to-pay process, such as slow approvals or unreliable vendors.
- Direct procurement leans on lead time, defect rate, and on-time delivery, while indirect procurement leans on PO cycle time, compliance, and spend under management.
- Tracking by hand does not scale. Platforms that pull KPI inputs from live transactions keep the numbers current without monthly spreadsheet work.
- KPIs are not static. Review them on a set cadence and retire any that no longer change a decision.
What Are Procurement KPIs?
A procurement KPI is a measurable indicator of how well one part of the buying process performs, from sourcing and approvals to invoice and payment. Each KPI procurement teams track should have an owner, a formula, and a review date. Without those, it is a number on a slide. APQC groups recommended procurement measures into cost effectiveness, cycle time, process efficiency, and staff productivity, and the 11 below cover those areas plus vendor quality, compliance, and risk across the procure-to-pay process. For the bigger picture, see our guide to what procurement is.
Common procurement KPI examples include:
- Cost savings and cost avoidance
- Purchase order cycle time
- Vendor lead time and on-time delivery
- Contract compliance rate
- Discrepancy rate on the goods received note
Certain key performance indicators lag behind, and others lead. Those relating to cost reduction, defect rate, and ROI tell you about what has already taken place, while those concerning the purchase order cycle time, vendor lead time, and on-time delivery caution you while you still have the opportunity to take action. A scorecard must include both types.

You can’t manage what you don’t measure. Procurement success demands KPIs tied to value-building, not just cost-avoided.
– Peter Smith
[BBC’s “Procurement Experts”]
Why Procurement KPIs are Important
Procurement has gone beyond cost-cutting and now promotes growth, resilience, and risk control, which requires data rather than relying on instinct. KPIs assist in three ways.
- They show what is happening: The key performance indicators extend throughout the entire procurement life cycle, not simply to the final outcome, which means that delays and failures to receive goods are detected early.
- They make your case with numbers: When you address people in a position of leadership, it is the figures relating to savings, risk control, and progress in the area of ESG that hold greater significance than opinions.
- They align teams: When the key performance indicators are linked to the strategic objectives, then everyone knows what success means, whether or not they manage the buyers themselves or work with vendors via a vendor management system.
The 11 Essential Procurement KPIs to Track in 2026
Use these 11 procurement KPI examples as a starting set. Each pairs a formula with the reason it earns a place on the scorecard.
| # | KPI | Formula | Why It Earns a Place |
|---|---|---|---|
| 1 | Cost reduction | (Previous cost − current cost) ÷ previous cost | Shows tangible value to finance and links procurement to operating margin |
| 2 | Cost avoidance | (Initial vendor quote − negotiated price) × quantity | Proves the value of proactive sourcing; report it apart from savings |
| 3 | Purchase order cycle time | PO placement date − requisition date | Flags approval bottlenecks and manual steps in the procure-to-pay process |
| 4 | Vendor lead time | Goods received date − PO placement date | Shows reliability and drives forecasting and safety stock |
| 5 | Vendor defect rate | (Defective items ÷ total items received) × 100 | Flags quality problems early and feeds vendor scorecards |
| 6 | On-time delivery rate | (On-time deliveries ÷ total deliveries) × 100 | Protects production schedules and customer commitments |
| 7 | Procurement ROI | (Savings + cost avoidance) ÷ procurement operating costs | Justifies investment in people, tools, and training |
| 8 | Compliance rate | (Compliant transactions ÷ total transactions) × 100 | Reduces audit and legal exposure; supports ESG mandates |
| 9 | Vendor risk rating | Composite score across financial, operational, compliance, and reputational risk | Prioritizes mitigation and diversification of the vendor base |
| 10 | Spend under management | (Managed spend ÷ total organizational spend) × 100 | Shows procurement’s reach and maturity |
| 11 | Diverse vendor spend | (Diverse vendor spend ÷ total spend) × 100 | Supports ESG and inclusion goals and a broader sourcing network |
What the Benchmarks Say
The most common question about any KPI is what a good number looks like.
APQC publishes all-company medians from its Open Standards Benchmarking database: 2.0 days to issue a purchase order for goods, 40 days from purchase order to payment for goods, 55 days for services, and 1.2% of purchases made through maverick buying, where employees ignore an existing contract.
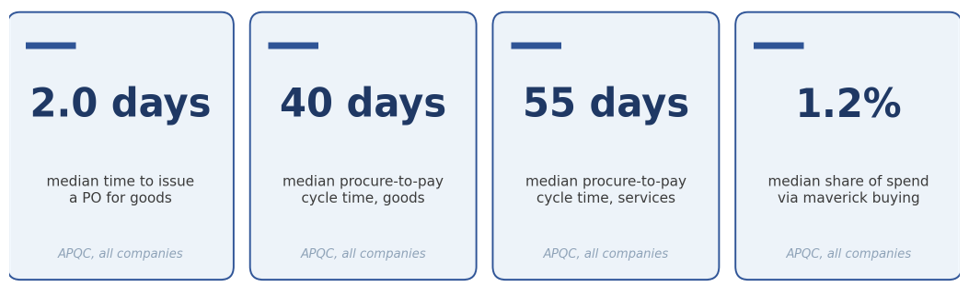
APQC Open Standards Benchmarking, all-company medians (measure pages linked above)
Take medians as a starting point rather than as a goal. Your spend mix, industry and payment terms all affect these figures. Since the procure-to-pay figures continue until the payment has been made, they take into account your vendor’s payment terms. When APQC publishes a median figure for your industry, compare your own figure to it and keep track of your trend on a quarterly basis.
The article we have on procurement benchmarking goes through each step of the process. Treat the gap as a starting point, not as a final judgment. When your PO cycle time for goods is considerably above 2.0 days, begin by looking at the approval routing. If maverick buying is well above 1.2 percent, then check contract awareness and catalog coverage before blaming the buyers.
Direct vs Indirect Procurement KPIs
Direct procurement buys what goes into the product. Indirect procurement buys everything else, such as software, services, and facilities. Direct procurement metrics lean on supply continuity: vendor lead time, defect rate, on-time delivery, and vendor risk, because a late or defective part stops a line. Indirect programs lean on control: PO cycle time, compliance, spend under management, and cost avoidance, because the risk is spend that never passes through procurement.
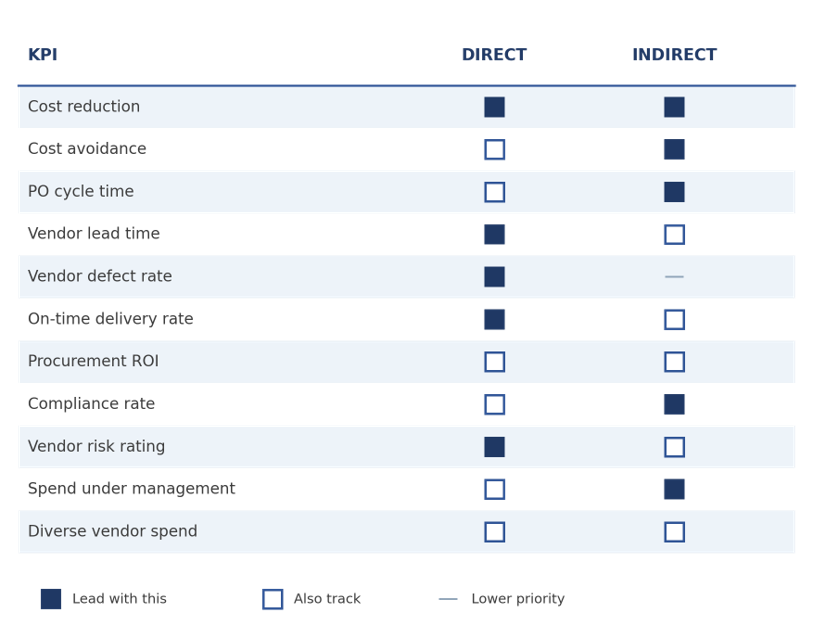
Suggested starting emphasis by spend type. This is a recommendation, not a benchmark.
Most teams run both, so build one scorecard with a direct view and an indirect view instead of averaging them together.
Common KPI Mistakes to Avoid
Most KPI programs stall for the same few reasons.
Measuring activity instead of outcomes
Purchase orders issued show how busy the team is. Cost reduction and cycle time show whether the work is paying off.
Tracking too many KPIs
Beyond eight KPIs, the extras rarely drive action.
Blending savings and avoidance
The finance department will object to the total figure, so it is necessary to state the figures separately.
Skipping the baseline
Since there is no starting figure with a KPI, progress cannot be shown; therefore, you should note down the figure for today before any changes take place.
Leaving KPIs without an owner
Every metric needs one named person who can explain why it moved.
Comparing against the wrong benchmark
A median built on a different industry or spend mix misleads. Compare like with like.
How to Track and Use Your Procurement KPIs
Tracking KPIs is not about dashboards or data dumps. It is about feeding live numbers back into every stage of the buying cycle. Six habits make that work.
- Automate KPI tracking: Manual tracking brings delays, errors, and blind spots. Use e-procurement software or a modern procurement platform to collect and calculate KPIs such as cost reduction, PO cycle time, and vendor defect rate from live data, with alerts when a metric leaves its threshold.
- Build dashboards people open: A good dashboard makes it easy for managers to see what needs attention now and what can wait until the quarterly review. Most teams follow a similar rhythm.
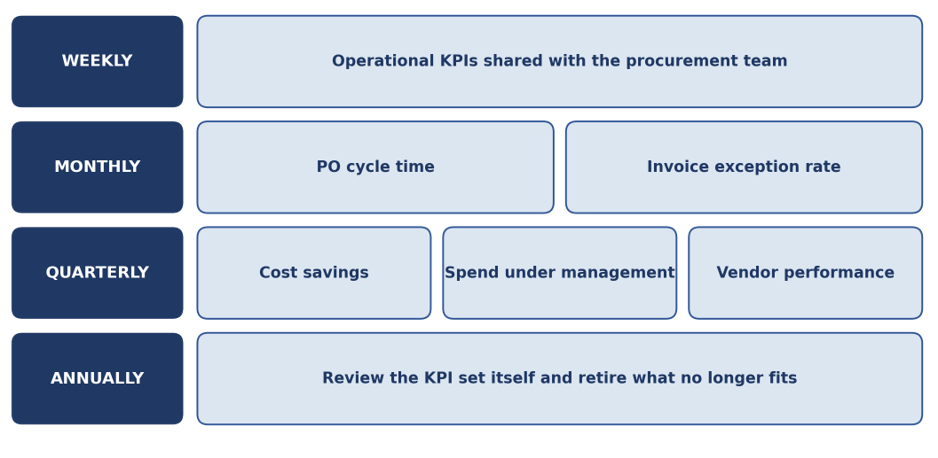
Sample review cadence for a procurement dashboard
- Set the KPIs in line with business goals: If vendor risk is something that worries you, then make sure that the risk rating and compliance rate are given priority. If your focus is on your budget, then concentrate on cost reduction and keeping spending under control.
- Assess the situation regularly: Review the list every quarter or twice a year, remove any KPIs that no longer align with your procurement strategy, and add new ones to address new priorities, such as carbon footprint per purchase order.
- Create a data-literate culture: Help your team become comfortable with figures, linking each member’s goals to the appropriate KPIs, and discussing the results as a group. This kind of collaborative approach is a major advantage, particularly in the case of small teams in which people take on a wide range of responsibilities.
- Present the metrics to executives: They want decisions, not the raw data; accompany each figure with some context. For example, industry benchmarks or year-on-year changes, and use simple charts to illustrate the trends.
How Zapro AI Automates Procurement KPI Tracking
Zapro AI is more than purchasing software. It is a vendor management platform that keeps purchasing, onboarding, risk, and communication in one place, like a CRM for your vendors that records all interactions and transactions so nothing is missed for KPI tracking, and it gives you four things.
✓ One platform for purchasing, onboarding, risk, and vendor communication, so KPI inputs do not sit in separate tools.
✓ Real-time insight into vendor risk and performance through spend analytics dashboards.
✓ Faster onboarding and more effortless collaboration with vendors.
✓ Data-driven visibility that saves the time your team spends chasing numbers.
Not every KPI in this guide comes out of the box in every tool, so ask which ones do: see these KPIs tracked live in a demo and check the ones you need. Cost per purchase order is the KPI that most directly justifies software spend, so compare Zapro AI plans to model a target cost per transaction.
Procurement KPI FAQs
How Many Procurement KPIs Should You Track?
The majority of teams ought to report between six and eight KPIs, not thirty. By selecting a concentrated group that addresses cost, cycle time, compliance, vendor performance, and risk, management can obtain a full overview without spreading its attention too thin. Large dashboards don’t work because no one takes any action based on them; if a metric has not influenced a decision over a period of two quarters, then it is merely adding to the reporting load rather than serving as a true KPI. Begin with the two or three KPIs that are related to the current bottleneck and just broaden the range when those have become stable.
What Is the Difference Between Cost Savings and Cost Avoidance?
Savings involve reducing expenditure in comparison with a previous baseline, for example, spending less this year than last year, while cost avoidance stops an increase that would have taken place, such as agreeing to a lower price than the vendor has proposed. Finance handles the two categories differently in that savings are included in the budget, but avoidance generally is not. When teams combine both and present them as a single figure, the entire amount is usually challenged, so it is advisable to show them separately.
What Is a Good Spend Under Management Percentage?
There is no universal standard, and it is the direction of movement that is more important than the exact figure; procurement functions that are well advanced generally have an impact on most of their addressable spending, whereas those which are at an early stage often end up being well below half even if they are not aware of it. Take your own figure as a baseline, omit the categories that are not addressable, such as taxes and payroll, and instead monitor the trend on a quarterly basis rather than comparing yourself with general benchmarking data which is based on a different spend mix.
Which Procurement KPIs Do CFOs Care About Most?
What concerns CFOs are the figures related to cash and the profit and loss statement. For example, cost savings, cost avoidance, and return on investment. Meanwhile, CPOs require more everyday metrics such as cycle time and defect rates. Since one dashboard isn’t suitable for both, the operational KPIs should be shared with procurement, and the cash impact should be broken down for finance.
How Often Should Procurement KPIs Be Reviewed and Reported?
Check ops KPIs like PO cycle time and invoice exceptions every month, since you can still fix issues that quarter. Share cost savings, spend under management, and vendor performance each quarter, lined up with the finance calendar. Once a year, review your KPIs and drop the ones that no longer fit.
Automate KPI Tracking
Procurement KPIs only help when the numbers arrive on time and come from live data. Pick the six to eight tied to your current bottleneck, set a benchmark and a review date for each, and stop assembling them by hand. Zapro AI collects KPI inputs from purchasing, onboarding, and vendor activity in one platform, so cycle time, vendor performance, and risk update as the work happens.
Unlock smarter decisions with Zapro’s powerful procurement analytics.

Procurement KPI FAQs
1. How many procurement KPIs should you actually track?
Most procurement teams should report on six to eight KPIs, not thirty. A focused set covering cost, cycle time, compliance, supplier performance and risk gives leadership a complete picture without diluting attention. Large dashboards fail because nobody acts on them — if a metric hasn’t changed a decision in two quarters, it’s reporting overhead rather than a KPI. Start with the two or three tied to your current bottleneck and expand only when those are stable.
2. What is the difference between cost savings and cost avoidance?
Cost savings reduce spend against a prior baseline — you paid $500,000 last year and $450,000 this year. Cost avoidance prevents an increase that would otherwise have happened, such as negotiating a supplier’s proposed 8% price rise down to 3%. The distinction matters because finance treats them differently: savings appear in the budget, avoidance usually does not. Procurement teams that report both without separating them tend to have their whole savings number disputed.
3. What is a good spend under management percentage?
There is no universal benchmark, but the direction of travel matters more than the absolute figure. Mature procurement functions typically influence the large majority of addressable spend, while teams early in their journey often sit well below half without realising it. The more useful exercise is to baseline your own figure, exclude genuinely non-addressable categories such as taxes and payroll, and track the trend quarterly rather than comparing against generic procurement benchmarking data built on a different spend mix.
4. Which procurement KPIs matter most to a CFO?
CFOs care about the metrics that touch cash and the P&L: realised cost savings, cost avoidance, spend under management, days payable outstanding and procurement ROI. CPOs need a wider operational set including cycle time, supplier OTIF and defect rates. The practical implication is that one dashboard rarely serves both — report operational KPIs weekly to the procurement team and translate them into cash and margin language for the finance review.
5. How often should procurement KPIs be reviewed and reported?
Review operational KPIs such as requisition-to-PO cycle time and invoice exception rate monthly, since those are the ones you can still act on inside the quarter. Report cost savings, spend under management and supplier performance quarterly, aligned to the finance calendar so procurement’s numbers land alongside the figures leadership is already reviewing. Revisit the KPI set itself annually — metrics that no longer map to business priorities should be retired rather than carried forward.
Don’t miss our weekly updates
We’ll email you 1-3 times per week—and never share your information.
Let’s Optimize Your Procurement Performance
Connect with our team to unlock tailored solutions that elevate your KPIs and drive results.

About the Author

Md. Kafil


About the Reviewer

Zapro is dedicated to helping businesses of all sizes make informed decisions. We adhere to strict editorial guidelines to ensure that our content meets and maintains our high standards.
Our editorial standards help keep every article accurate, useful, and trustworthy.
Related Blogs
Wait! Don't Leave Without This Free Guide
How AI Is Replacing Manual Procurement And What Your Team Should Do Next