


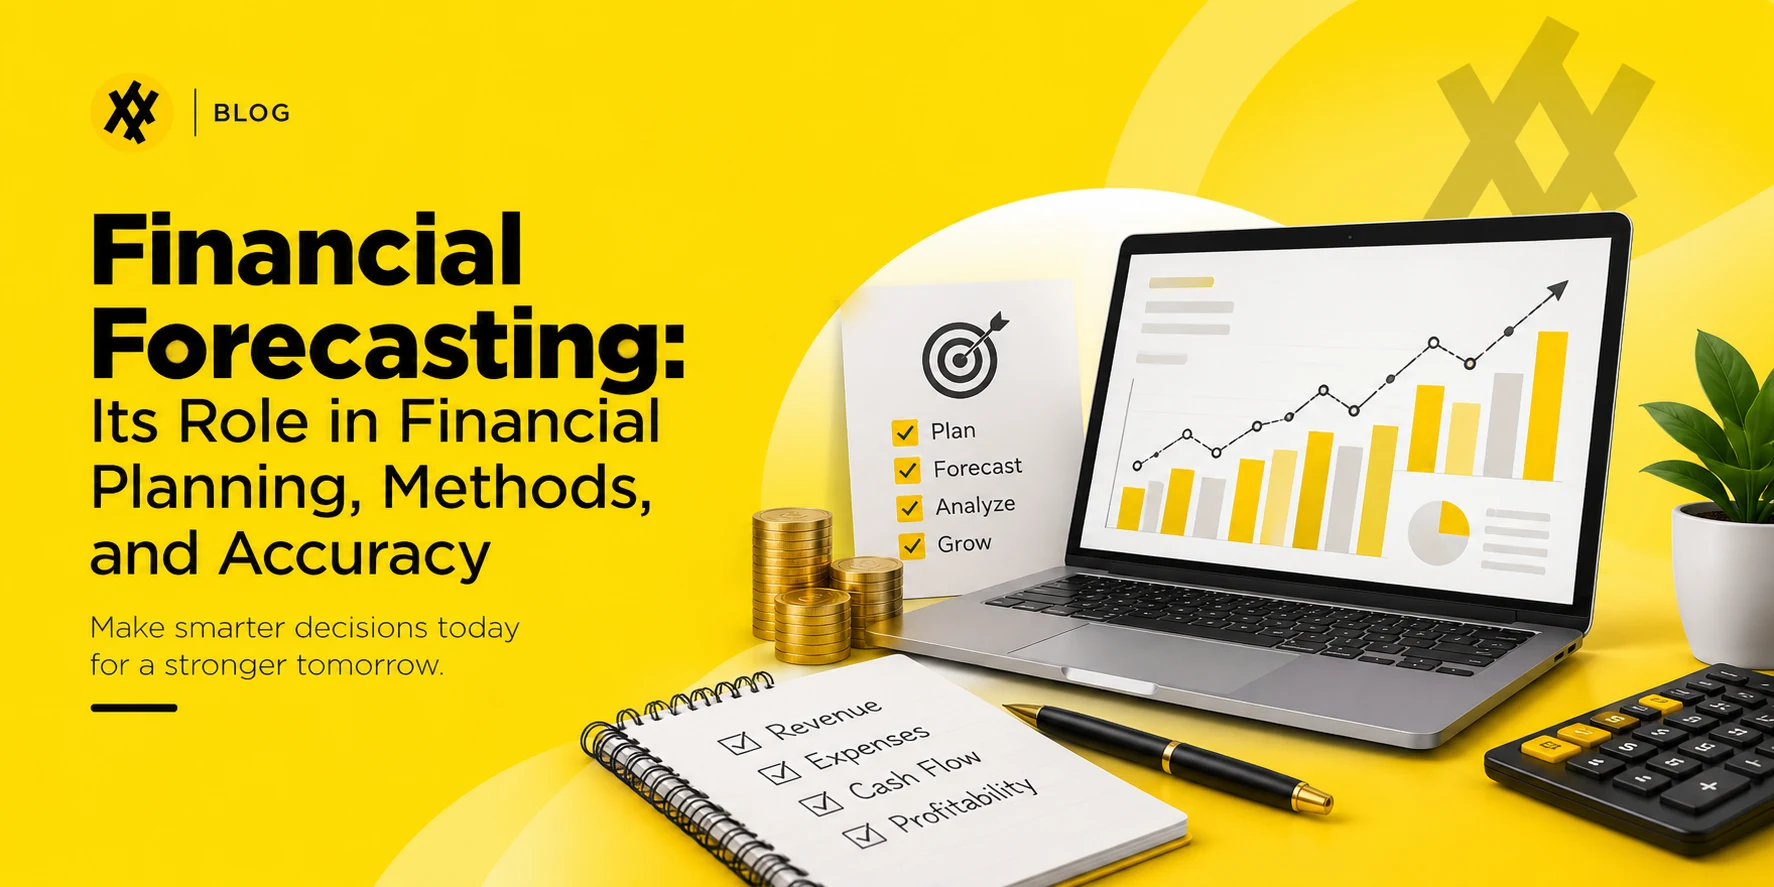
Financial forecasting is a method of predicting an organisation’s future financial performance using historical results, current commitments, and stated assumptions. It helps companies plan their budget. It attempts to foresee expected revenue, costs, and cash position over a defined horizon, and update them as conditions change.
Key takeaways
- A forecast estimates what will happen and helps in planning a budget.
- Forecasting in financial planning keeps the plan connected to reality between planning cycles.
- What method to choose for your financial planning depends on data volume, horizon, and volatility.
- Open purchase orders and the requisition pipeline are the earliest reliable signal of future spend.
At the start of the year, you plan a budget for your company’s expenses. But how will you do that? On what basis will you be creating your budget? Data. Different kinds of ‘research’ data. Financial forecasting is the name of that research method. You do this process by working with historical accounts data, already made commitments, and theorise what your spending and earnings look like in the year ahead.
This gives your organisation a base to work with and come up with a practical budget plan, hence empowering the company to make informed financial decisions.
What is financial forecasting?
Financial forecasting estimates future financial outcomes from evidence: historical actuals, commitments already made, and assumptions stated openly enough to be argued with.
The test of a forecast is not whether it turns out right, but whether the reasoning was sound and whether it changed a decision.
Financial forecasting vs. financial prediction vs. projection
These three are often used interchangeably, but they shouldn’t be.
A forecast is the expected outcome given current conditions and existing plans. It is the number you would bet on.
A prediction is a broader statement about the future, often qualitative and without a defined method behind it. In finance the word signals less rigour.
A projection answers a conditional question: what happens if a specific scenario occurs. Projections are hypothetical by design, which is why they are used for scenario planning and fundraising rather than operational decisions.
Use forecast for your base case, projection for scenarios, and avoid prediction entirely in internal documents.
What a financial forecast contains
At minimum: forecast revenue, costs by category, cash position, the horizon covered, the assumptions used, and the method applied. Anything missing the last two is a number, not a forecast, because nobody can evaluate it later.
What is the role of forecasting in financial planning?
Forecasting in financial planning keeps the plan tethered to what is actually happening. A financial plan is built once and sets direction for a year. Forecasts are produced continuously and tell you whether that direction still holds, where the plan is drifting, and when it needs revising rather than defending.
How forecasts feed the annual plan
The annual plan starts from a forecast. Before targets are negotiated, finance produces a base-case view of where the business lands if nothing changes, and every proposed target is measured against it.
Without it, planning becomes a negotiation between departmental asks and last year’s numbers, with no independent view of what is achievable.
How forecasts trigger mid-year plan revisions
A plan is a decision made with incomplete information. Forecasts are how you find out which parts of that decision no longer hold.
Set a trigger in advance rather than deciding case by case. A common approach: when the rolling forecast diverges from plan by more than a defined percentage for two consecutive periods, formally revisit the plan. Without a stated trigger, the plan gets defended long after it stops being achievable.
Budgeting vs. financial planning vs. forecasting
| Financial planning | Budgeting | Forecasting | |
| Question it answers | Where are we going? | What may each team spend? | Where will we actually land? |
| Time horizon | One to five years | Usually one year, fixed | Rolling, often 12 months ahead |
| How often it changes | Annually or on strategy change | Rarely once set | Monthly or quarterly |
| Nature of the numbers | Directional | Authorizations | Estimates |
| Owned by | Executive team and board | Finance with budget holders | FP&A or finance |
| Judged by | Whether goals were met | Whether spending stayed within it | Accuracy against actuals |
The confusion that causes the most damage is treating the forecast as a target. Once people are measured on hitting a forecast, they start managing the forecast rather than reporting it, and its value as information disappears.
Where is forecasting’s place in the FP&A cycle
The cycle runs: close the period, report actuals, compare against plan and prior forecast, update the forecast with new information, and feed it into the next round of decisions. Forecasting converts completed history into a forward view, making it the bridge between reporting and decision-making.
Types of financial forecasting
Cash flow forecasting
Projects cash in and out over a short horizon, usually 13 weeks. It answers whether you can meet obligations, and matters most when liquidity is tight, because a profitable business can still run out of cash.
Revenue and income forecasting
Estimates revenue and resulting profit over quarters or years. It drives hiring, investment, and capital decisions, and carries the most political pressure.
Sales forecasting
Estimates units or bookings from the pipeline. It feeds revenue forecasting but is a separate exercise with different owners, data, and bias profile. Where the business holds stock, the same unit estimates also feed supply chain forecasting and inventory planning.
Expense and budget forecasting
Projects operating costs by category. It is the most improvable forecast in most organisations, because much of the spend is already committed and simply not visible to finance yet.
Headcount and capex forecasting
People and capital assets are both lumpy and both decided by lead times rather than run rates. Forecast them from hiring plans and project schedules, not by extrapolating last year.
Financial forecasting methods
Straight-line forecasting
Applies a constant growth rate to the prior period. Simplest method, and adequate where growth is stable.
Formula: Forecast = prior period × (1 + growth rate)
Example: Q4 revenue was $4.2 million and quarterly growth has averaged 6%. Q1 forecast: $4.2M × 1.06 = $4.45 million.
Its weakness is that it assumes the past rate continues, so it misses inflection points entirely.
Moving average
Averages recent periods to smooth short-term noise. The single moving average is the simplest smoothing technique in time series analysis.
Formula: Forecast = sum of last n periods ÷ n
Example: Revenue for the last three months was $420k, $445k, and $470k. The three-month moving average forecast is (420 + 445 + 470) ÷ 3 = $445k.
Note what happened: the series is rising steadily, and the moving average forecast sits below the most recent month. Moving averages lag trends, which makes them good for volatile data and poor for trending data.
Simple linear regression
Fits a straight line between one driver and the outcome, giving both a forecast and a measure of the relationship. Penn State’s open regression methods course notes cover the assumptions behind the method in more depth.
Formula: y = a + bx, where b is the slope, and a is the intercept.
Example: Marketing spend against revenue over five periods, in thousands:
| Marketing spend (x) | Revenue (y) |
| 10 | 100 |
| 12 | 118 |
| 14 | 132 |
| 16 | 152 |
| 18 | 168 |
Mean x is 14 and mean y is 134. Summing the products of deviations gives 340, and the sum of squared x deviations is 40. So b = 340 ÷ 40 = 8.5, and a = 134 − (8.5 × 14) = 15.
The equation is y = 15 + 8.5x. At $20k of marketing spend, forecast revenue is 15 + (8.5 × 20) = $185k.
The slope is the useful output. Each additional $1k of marketing is associated with $8.5k of revenue in this data, which is a statement you can test rather than assert.
Multiple linear regression
Extends the same logic to several drivers at once.
Formula: y = a + b₁x₁ + b₂x₂ + … + bₙxₙ
Revenue might be modelled against marketing spend, headcount in sales, and average deal size together. Each coefficient shows that driver’s contribution with the others held constant.
Two cautions. Correlated drivers produce unstable coefficients, so adding variables that move together makes the model worse rather than better. And a model fitting history perfectly is usually fitting noise.
Delphi method
A structured qualitative method developed at RAND in the 1950s. A panel forecasts independently, sees the anonymised range, and revises. Over two or three rounds, it converges without the loudest voice dominating.
Use it where historical data does not exist: a new market, a new product category, or a regulatory change with no precedent.
Jury of executive opinion
Senior leaders produce a forecast collectively from experience. It is fast and captures knowledge no dataset holds, such as a deal about to close or a customer about to leave.
Its weakness is well documented. Seniority outweighs accuracy in the room, and the number carries no method anyone can audit afterwards.
Which method fits which situation
| Method | Data needed | Best horizon | Handles volatility | Skill required |
| Straight-line | Minimal history | Short | Poorly | Low |
| Moving average | 6+ periods | Short | Well | Low |
| Simple regression | 12+ periods, one clear driver | Medium | Moderately | Medium |
| Multiple regression | 24+ periods, several drivers | Medium to long | Moderately | High |
| Delphi | None required | Long | Not applicable | Medium |
| Executive opinion | None required | Short to medium | Not applicable | Low |
The common error is reaching for regression when the underlying data cannot support it. A regression on nine noisy months produces a confident-looking number with nothing behind it, and a moving average would have been more honest.
Why financial forecasts fail
Stale or incomplete data
Forecasts built on a month-old export miss everything since, including commitments already made. The cost of that delay usually exceeds any method improvement.
Sandbagging and optimism bias
Sales forecasts run low where quotas depend on them; project budgets run low where approval depends on them. Both are rational responses to how the number is used. Measuring bias by owner surfaces it without accusation.
Siloed data between finance and operating teams
Procurement knows about a committed purchase weeks before finance sees an invoice. Where those systems do not connect, finance forecasts spend that has already been decided.
Forecasting entirely in spreadsheets
Spreadsheets are fine for the model and poor as the system of record. Version drift, broken references, and untraceable overrides accumulate quietly, until reconciling a forecast to its own inputs becomes a task in itself. Teams replacing spreadsheet purchase logs can compare the best procurement software for a connected record of commitments.
Force majeure and unmodeled shocks
Some events cannot be forecast. The reasonable response is not a better model but scenario planning, so the organisation has already thought about what it would do rather than discovering it under pressure.
Forecast better with Zapro
The gap between a good forecast and a poor one is usually the data underneath it. Committed spend that finance cannot see is spend that gets forecast as though the decision had not been made.
Zapro AI holds requisitions, approvals, purchase orders, receipts, and invoices in one place, so the open PO balance and requisition pipeline are visible as they build rather than when invoices arrive. The same record supports financial auditing afterwards and a spend analysis of what actually happened. Teams sizing the investment can compare plans on the Zapro pricing page.
Book a demo to see committed and uncommitted spend separated in a live view.
Frequently asked questions about financial forecasting
What is the role of forecasting in financial planning?
Forecasting keeps the financial plan connected to reality. The plan sets direction annually; forecasts are produced continuously and show whether that direction still holds, where performance is diverging, and when the plan needs revising rather than defending.
What is the difference between financial forecasting and financial planning?
Planning sets goals and direction over one to five years and changes rarely. Forecasting estimates where the business will actually land over a rolling horizon and updates monthly or quarterly. Planning decides where to go; forecasting reports whether you are getting there.
What is financial prediction?
Financial prediction is a general term for statements about future financial outcomes, often without a defined method behind it. In practice, use “forecast” for a base case built from evidence and “projection” for a conditional scenario, and reserve “prediction” for informal use.
What are the four types of financial forecasting?
Most commonly cash flow, revenue and income, sales, and expense forecasting. Larger organizations add headcount and capital expenditure forecasting, which behave differently because both are driven by lead times rather than run rates.
How far ahead should you forecast?
Match the horizon to the decision. Cash flow forecasts typically run 13 weeks. Revenue and expense forecasts commonly run 12 months on a rolling basis. Anything beyond three years is planning rather than forecasting, since the assumptions cannot be evidenced.
What is the difference between a forecast and a budget?
A budget authorizes spending and is normally fixed once approved. A forecast estimates what will actually happen and updates as conditions change. A budget is a commitment; a forecast is information. Treating a forecast as a target destroys its usefulness.
Can you do financial forecasting in Excel?
Yes, and most organizations do. Excel handles the modelling well. The limitation is that it is a poor system of record: version drift, broken references, and manual overrides accumulate, and the underlying data still has to come from somewhere current.
Don’t miss our weekly updates
We’ll email you 1-3 times per week—and never share your information.
About the Author

Oishani Bhattacharya


About the Reviewer

Zapro is dedicated to helping businesses of all sizes make informed decisions. We adhere to strict editorial guidelines to ensure that our content meets and maintains our high standards.
Our editorial standards help keep every article accurate, useful, and trustworthy.